Example files for exercises
Databases:
Pan-STARRS1 data archive
SDSS DR18
AAVSO
Software:
DS9
Aladin
IRIS – a free image processing software for Windows
Makalii – a free image processing software for Windows
Aperture Photometry Tool
FITS files:
Bias
Flat
Flat normalized
Object (original, not processed)
Object (bias corrected)
Object (flat corrected)
Project 1:
This small project aims to get familiar with preparation for real observations with the NOT telescope. You will be given the name and coordinates of an object for which you have to
1: Find the optimal month for observing [roughly, when the object culminates in the middle of night]. You can use the NOT visibility plot.
2. Create a star chart using, for example, the Variable Star Plotter from the AAVSO website. You can also consider using the PanSTARRS-1 Image Access. Don’t forget that the field of view of the NOT/ALFOSC instrument is ~6.5’x6.5′.
3. Calculate the exposure times needed to reach the requested signal-to-noise ratio of photometric measurements with ALFOSC in the filters B, V, R, and I at the given weather conditions.
Use the NOT Exposure Time Calculator.
4. Calculate the exposure times needed to reach the requested signal-to-noise ratio of spectroscopic observations with ALFOSC with a given grism at the given weather conditions.
Report everything you have done.
Project 2:
The aim of this small research project is to find the Spectral Energy Distribution (SED) of the accreting white dwarf V455 And, using its 5 images obtained through 5 filters.
These filters are B, V, R, and I (so you have to use the Vega system), and the sdss z (the AB system).
Download the images from here.
The project consists of three steps:
1: Find the optimal aperture size which allows measuring instrumental magnitudes with the highest accuracy:
Load the V image to gaia and measure instrumental magnitudes of 1-2 stars changing the aperture size from 3 to 15 pixels. Find at which aperture the errors will be the smallest.
2. Using this aperture size, measure the instrumental magnitudes of V455 And and 3 comparison stars in all 5 filters (B, V, R, I, z), and find the apparent magnitudes of your target.
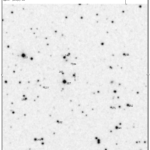
The star chart is shown below, the magnitudes of comparison stars (in the BVRI filters) can be found here.
The z magnitudes can be found using Aladin (the link is above) and the Pan-STARRS1 (PS1) catalogue (as we did it at one of the exercise sessions).
3. Convert the found magnitudes to fluxes and plot the Spectral Energy Distribution (SED).
4. Report everything you have done:
a) the optimal aperture size with the corresponding plot;
b) the measured instrumental magnitudes and the found apparent magnitudes;
c) the calculated fluxes in all 5 filters and the SED plot.
- Chart

