IPs: the analysis of the colour spin variability
Despite numerous multicolour observations of IPs conducted and published in the past, there are very few reports on the analysis of the colour spin variability. In order to conduct such an analysis, we requested our colleagues worldwide to provide us with their multicolour light curves. We were generously given the data of eight ironclad and confirmed IPs which show prominent spin modulations in the optical wavelengths alongside with different sidebands. An analysis of all these data was performed in a similar fashion: we calculated the power spectra of the light and different colour curves, and then compared the light and colour curves folded with the spin period.
We found that in all the IPs the power spectrum of the (B-I) or similar colour curve is dominated by a peak at the spin period with little power at the sidebands, in spite of the fact that in several systems the sideband variability is more prominent in the optical light curve than the spin modulation. As for energy dependence and phasing of the spin pulses in different wavelengths, they have not appeared to be very consistent even for these ironclad IPs.
Power spectra and pulse profiles of individual stars:
AO Psc, V1223 Sgr, PQ Gem, FO Aqr, V405 Aur, NY Lup, IGRJ1509-6649, DQ Her, EX Hya
AO Psc
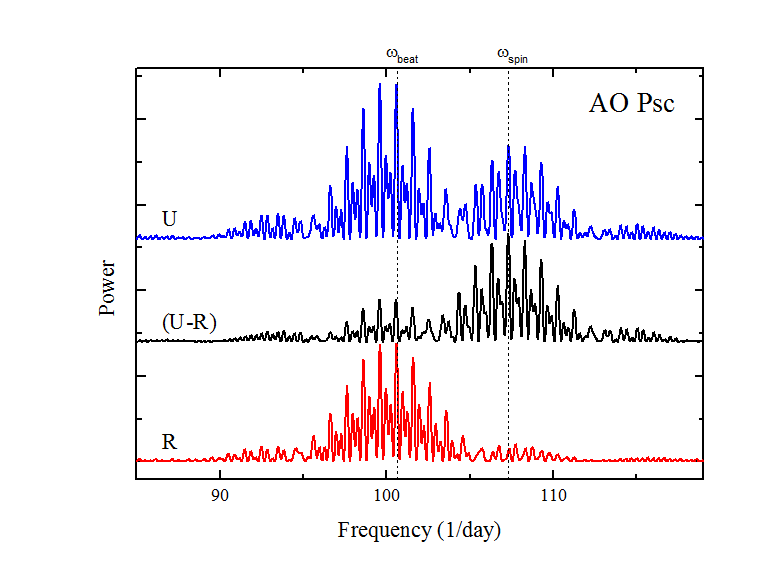
AO Psc is a well-known “ironclad” IP with an orbital period of 3.59 h and a spin period of 805.2 s. The spin modulation dominates in X-rays while the 858.7 s sideband is more prominent in the optical. The spin profiles are nearly sinusoidal in both the optical and X-rays, and they are in phase with each other. The wavelength dependence of the amplitude of the spin modulation is quite strong. The X-ray pulse amplitude decreases with increasing X-ray energy. In the optical, the amplitude increases toward shorter wavelengths. In order to analyze the variability of AO Psc in different colours, we have used the extensive set of simultaneous UBVR observations obtained by E. L. Robinson back in 1990-1992. We found that in spite of the fact that the sideband variability is more prominent in the optical light curve than the spin modulation, the power spectrum of the (U-R) colour curve is dominated by a peak at the spin period with little power at the sidebands. The (U – R) colour index is in phase with the optical and X-ray brightness.
V1223 Sgr
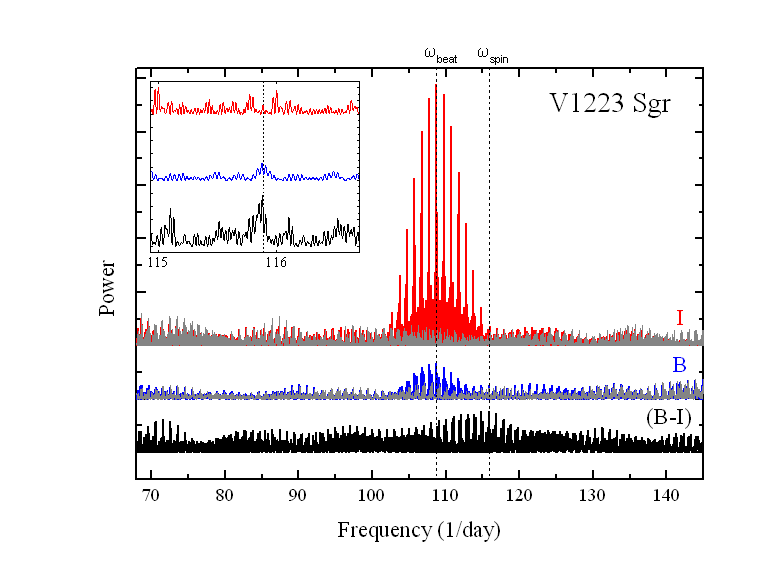
V1223 Sgr has an orbital period of 3.37 h and a spin period of 745.6 s. The sinusoidal spin modulation dominates in X-rays and shows the increasing depth with decreasing energy. In the optical, however, the object pulsates at the 794.4 s sideband and no pulsations have been found at the spin period.
During 29 nights of September-October 2011 and 25 nights of May-June 2012 we conducted time-resolved observations of V1223 Sgr using the same telescope and equipment as for the observations of FS Aur. The observations of 2011 were done in unfiltered light and with an integration time of 45 sec. Most observations of 2012 were made with the B and I filters and with exposure times of 70 and 30 sec respectively. A detailed analysis of these data will be discussed elsewhere, here we concentrate on the variability with the spin period.
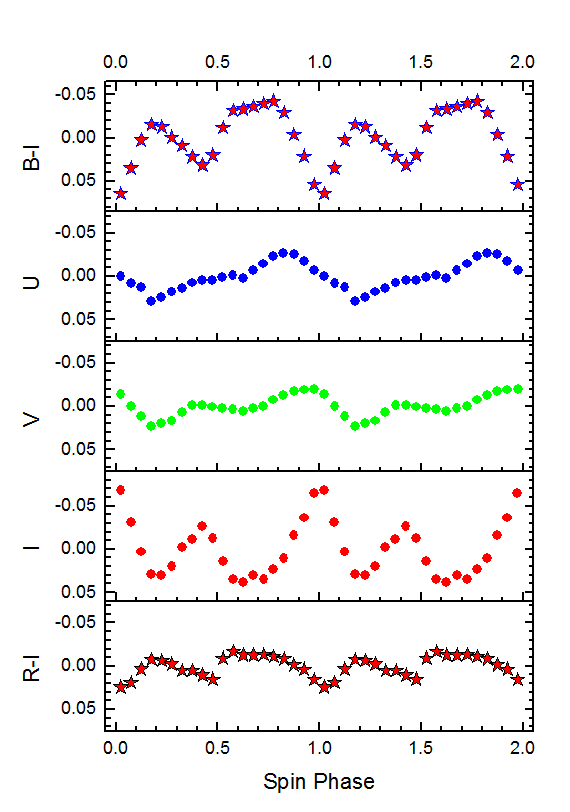
The 794.4 s sideband modulation was very strong in both filters. The power spectrum of the light curve is dominated by peaks at the sideband and orbital frequencies (108.76 and 7.13 1/day respectively) with no (in I) or negligibly little power (in B) at the expected spin frequency (Ω+ωbeat)=115.89 1/day. The latter modulation has not become apparent even in the pre-whitened light curve. However, in the power spectrum of the (B-I) colour-index curve a peak emerges at the exact spin frequency. Folding the (B-I) data over the spin period results in the nearly sinusoidal modulation with the amplitude of ~0.03 mag. The folded B and I data also show a sign of pulsations even though the latter are very weak in power spectra. It is interesting that the character of such variability is very different from what we detected in other IPs. During around a half of the spin period the B and I fluxes keep a nearly constant level, and then it increases in B and decreases in I. No pulsation is seen in the folded unfiltered light curve.
PQ Gem
PQ Gem is a well-known “ironclad” IP. It has an orbital period of 5.2 h and a spin period of 833 s. The spin-pulse profile is very complex and its colour and energy dependence is unique amongst the IPs. In the optical range, the profile changes from a double-peak shape in the I and K filters to a quasi-sinusoid in the U and B bands. In X-rays, the profile is quasi-sinusoidal above 10 keV, whereas at lower energies it is cut by the dip feature which becomes more prominent towards the lowest energies. In general, the X-ray spin profile is in phase with the U and B optical bands. We have made use of the simultaneous UBVRI observations of PQ Gem from November 1993 published by Hellier, Ramseyer, & Jablonski (1994), and calculated several colour curves. The power spectra of the (U – I) and (B – I) colour curves are strongly dominated by peaks at the spin period and its harmonics, with very little power at the sidebands. The (B – I) and even (R – I) colours are anti-phased with the I band.
FO Aqr
FO Aqr is the “king” of the IPs (Patterson 1994) with an orbital period of 4.85 h and a spin period of 1254.5 s. The spin modulation is clearly seen in optical photometry, optical spectroscopy and X-rays. The optical spin profiles are sinusoidal in all filters, and they are in phase with each other. The X-ray spin pulse profile is complex with a modulation depth that decreases with increasing X-ray energy. It appears to be a small delay of the X-ray modulation relative to the optical one.
We have made use of the UBVRI data published by Chiappetti et al. (1989). The amplitude of the optical modulation is much larger in the U band, decreases abruptly in B, and then more gradually goes to longer wavelengths. Thus, the corresponded hardness ratio in the optical band is in phase with the optical brightness.
V405 Aur
V405 Aur, similarly to PQ Gem, belongs to a small group of IPs that exhibit different spin-pulse profiles in different energy bands. This system with an orbital period of 4.16 h and a spin period of 545.4 s shows a double-peaked pulsation in the optical wavelengths and soft X-rays, and a single-peaked pulsation in harder X-rays. It is interesting to note that a single-peaked, sawtooth modulation is not in phase with a nearly symmetric and sinusoidal double-peaked pulsation. We have made use of the UBVRI data published by Allan et al. (1996). The power spectra of the light and colour curves are dominated by a peak at the first harmonic of the spin frequency. When folded with the spin period, the nearly symmetrical double-hump structure of the light curves is clearly seen in all the filters. The corresponding colour curves are in phase with the former.
NY Lup
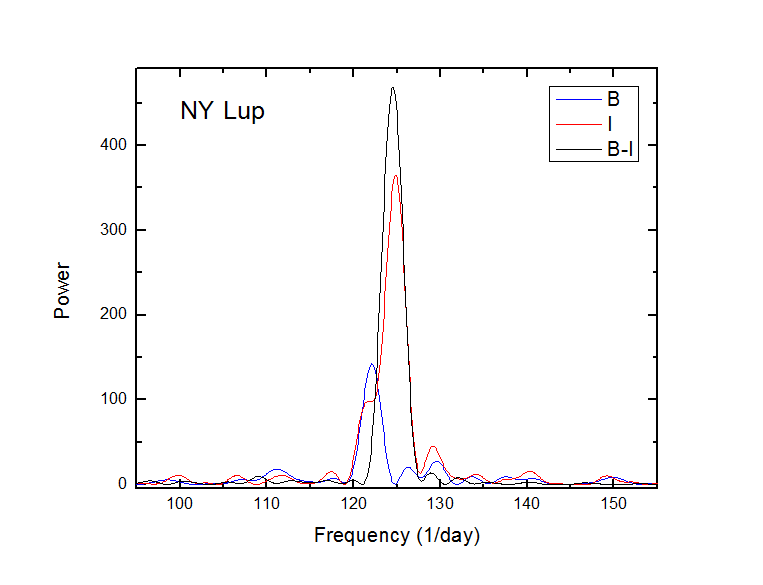
NY Lup is a long orbital period IP (9.9 h) with the WD spin period of 693 s. The latter is clearly seen both in the optical and X-rays, though the available ephemeris does not allow us to make their direct comparison. The optical photometry demonstrates the strong colour dependence of the signal. The power spectrum of the B data set does not show any power at the spin period but is instead dominated by a peak at the beat period (ω-Ω). (ω+2Ω) is significant as well. In the I filter, the spin period is most dominant even though the above-mentioned beat periods are also detected (see Fig. 3 in Potter et al. 2012). However, the power spectrum of the (B -I) colour curve created from Potter et al.’s data is exclusively dominated by a peak at the spin period with no power at the beats. Thus, the (B – I) colour index is anti-phased with the I brightness.
IGRJ1509–6649
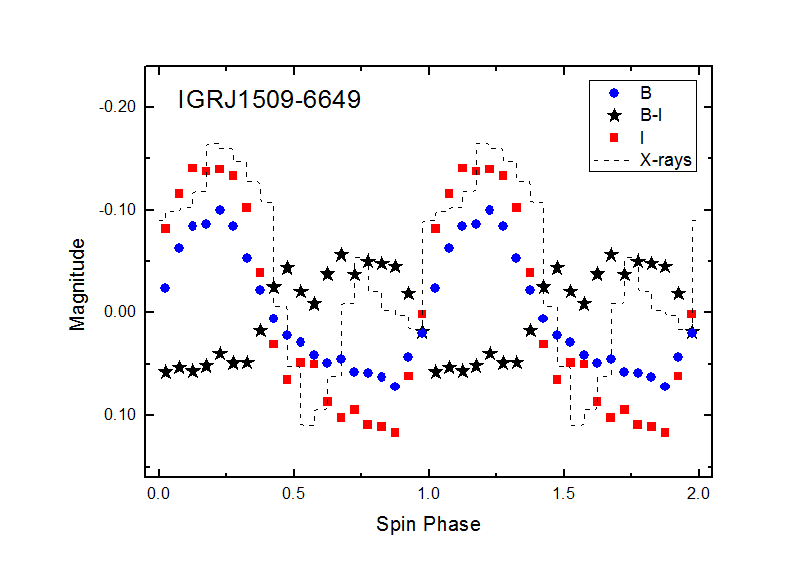
IGRJ1509–6649 is a recently discovered but already confirmed IP with a binary orbital period of 5.9 h and a WD spin period of 809 s. The optical and X-ray fluxes clearly show the WD spin modulation, and they are positively correlated. The X-ray spin pulse profile is complex with a modulation depth that decreases with increasing X-ray energy. The optical photometry shows approximately sinusoidal variations in both the B and I filters, which are in phase with each other. However, the (B -I) colour index is anti-phased with the optical and X-ray brightness.
DQ Her
DQ Her is a deeply eclipsing CV with an orbital period of 4.6 h and a fast-spinning magnetic WD. DQ Her is a prototype of IPs, but in spite of most other members of the class, it is a very weak X-ray source. It is widely thought that permanent obscuration of the WD by the accretion disc, due to its extreme inclination angle, is greatly reducing the X-rays reaching us. Nevertheless, in the optical, the system shows a coherent 71 s pulsation. There has been an ongoing, decades-long, discussion about whether the true spin period of the WD is the observed 71 s or twice this value, and it is still unclear which of the spin periods is to be preferred. We have made use of the UBVRI data published by Butters et al. (2009). The power spectra of the light and colour curves are dominated by a peak at 71 s and no power is found at 142 s. When folded with the latter period, the nearly symmetrical double-hump structure of the light curves is clearly seen in all the filters. The corresponded hardness ratio in the optical band is in phase with the optical brightness.
EX Hya
EX Hya is another eclipsing IP with a relatively long spin period of 67 minutes and a relatively short orbital period of 98 minutes. The fact that the spin period is almost exactly two-thirds of the orbital period creates some difficulties when interpreting observational data. The sinusoidal spin modulation is clearly seen both in the optical, UV and X-rays. However, the optical and UV pulse maximum occurs ~0.12 spin phase later than the X-rays one. We have used the BVR observations published by Belle et al. (2005). Data from the binary eclipse have been omitted. The power spectra of the light and colour curves are dominated by a peak at the spin frequency. When folded with the spin period, the sinusoidal variations are clearly seen in all the filters, which are in phase with each other and of nearly same amplitude. In spite of this, the (B -R) colour index also shows the spin modulation, even though of much smaller amplitude, and it is in phase with the optical light curves.

